


2013/2014 : Development of a unique water and fish monitoring template
• Over time the WCMG has developed some strong relationships with the Wairoa District Council and Hawkes Bay Regional Council, and has established an efficient way of monitoring water quality in the Whangawehi catchment.
• Using the best of both worlds. In 2013, the local community wanted to be more involved in a water monitoring programme that could measure the improvements of the restoration plan. The group developed a unique approach by using two techniques :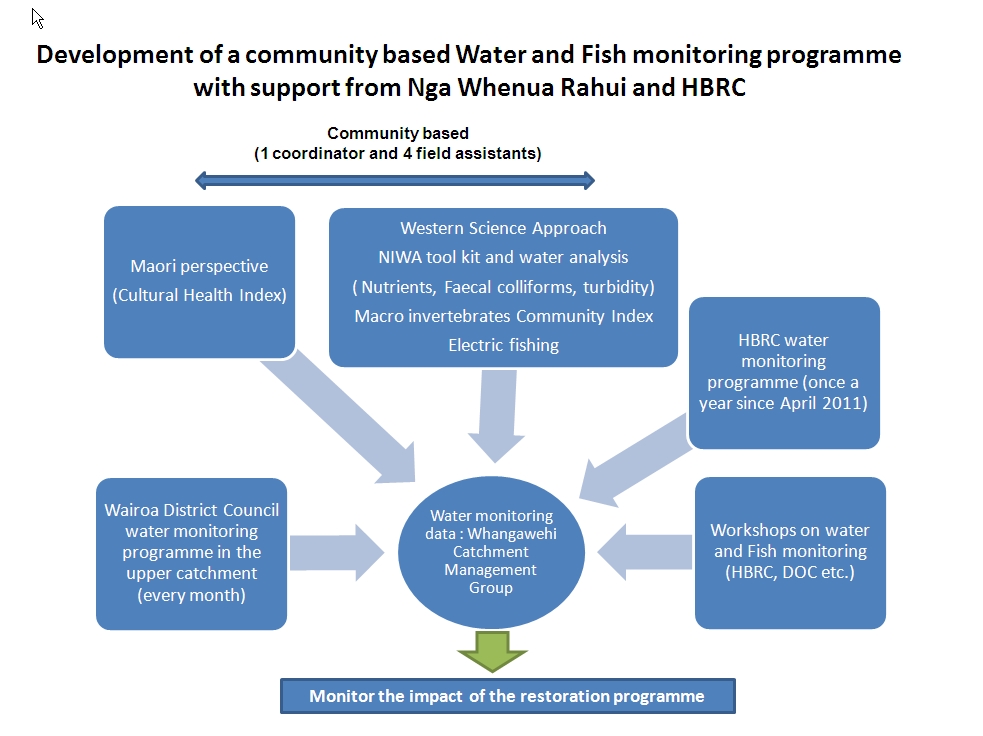
– a more western science based technique called Stream Health Monitoring Assessmentdeveloped by NIWA.
– a more cognitive, less scientific technique named Cultural Health Index.
• We successfully applied to Nga Whenua Rahui and trained a team of locals who assess the river 5 times a year since April 2013. The benefits of this project are quite valuable, as it empowers our community to collectively take ownership of our environmental issues and encourage positive behaviour change. The water monitoring team (which includes a local farmer) is also involved with the school programme (see newspaper article) and transfers the knowledge around fresh water ecosystems. The project is well underway and has developed a robust template that other groups are using to set up their own water monitoring programme.
2015/2016 : development of an integrated water monitoring programme
Since January 2015, the WCMG has been implementing a more comprehensive water monitoring plan developped in partnership with HBRC. This new water monitoring plan looks at better understanding our river and quantifying the various parameters that affect water quality. It also integrates and merges existing initiatives taking place in the catchment at different times of the year (The Cultural Health Index (WCMG), HBRC recreational monitoring, State of the environment, WDC waste water sampling programme etc) in order to save time and money. The goal is also to share the different sources of information with the wider community in a single and simple format. This powerfull monitoring tool has been developped to measure the impact of our restoration project overtime.
Background information :
A sur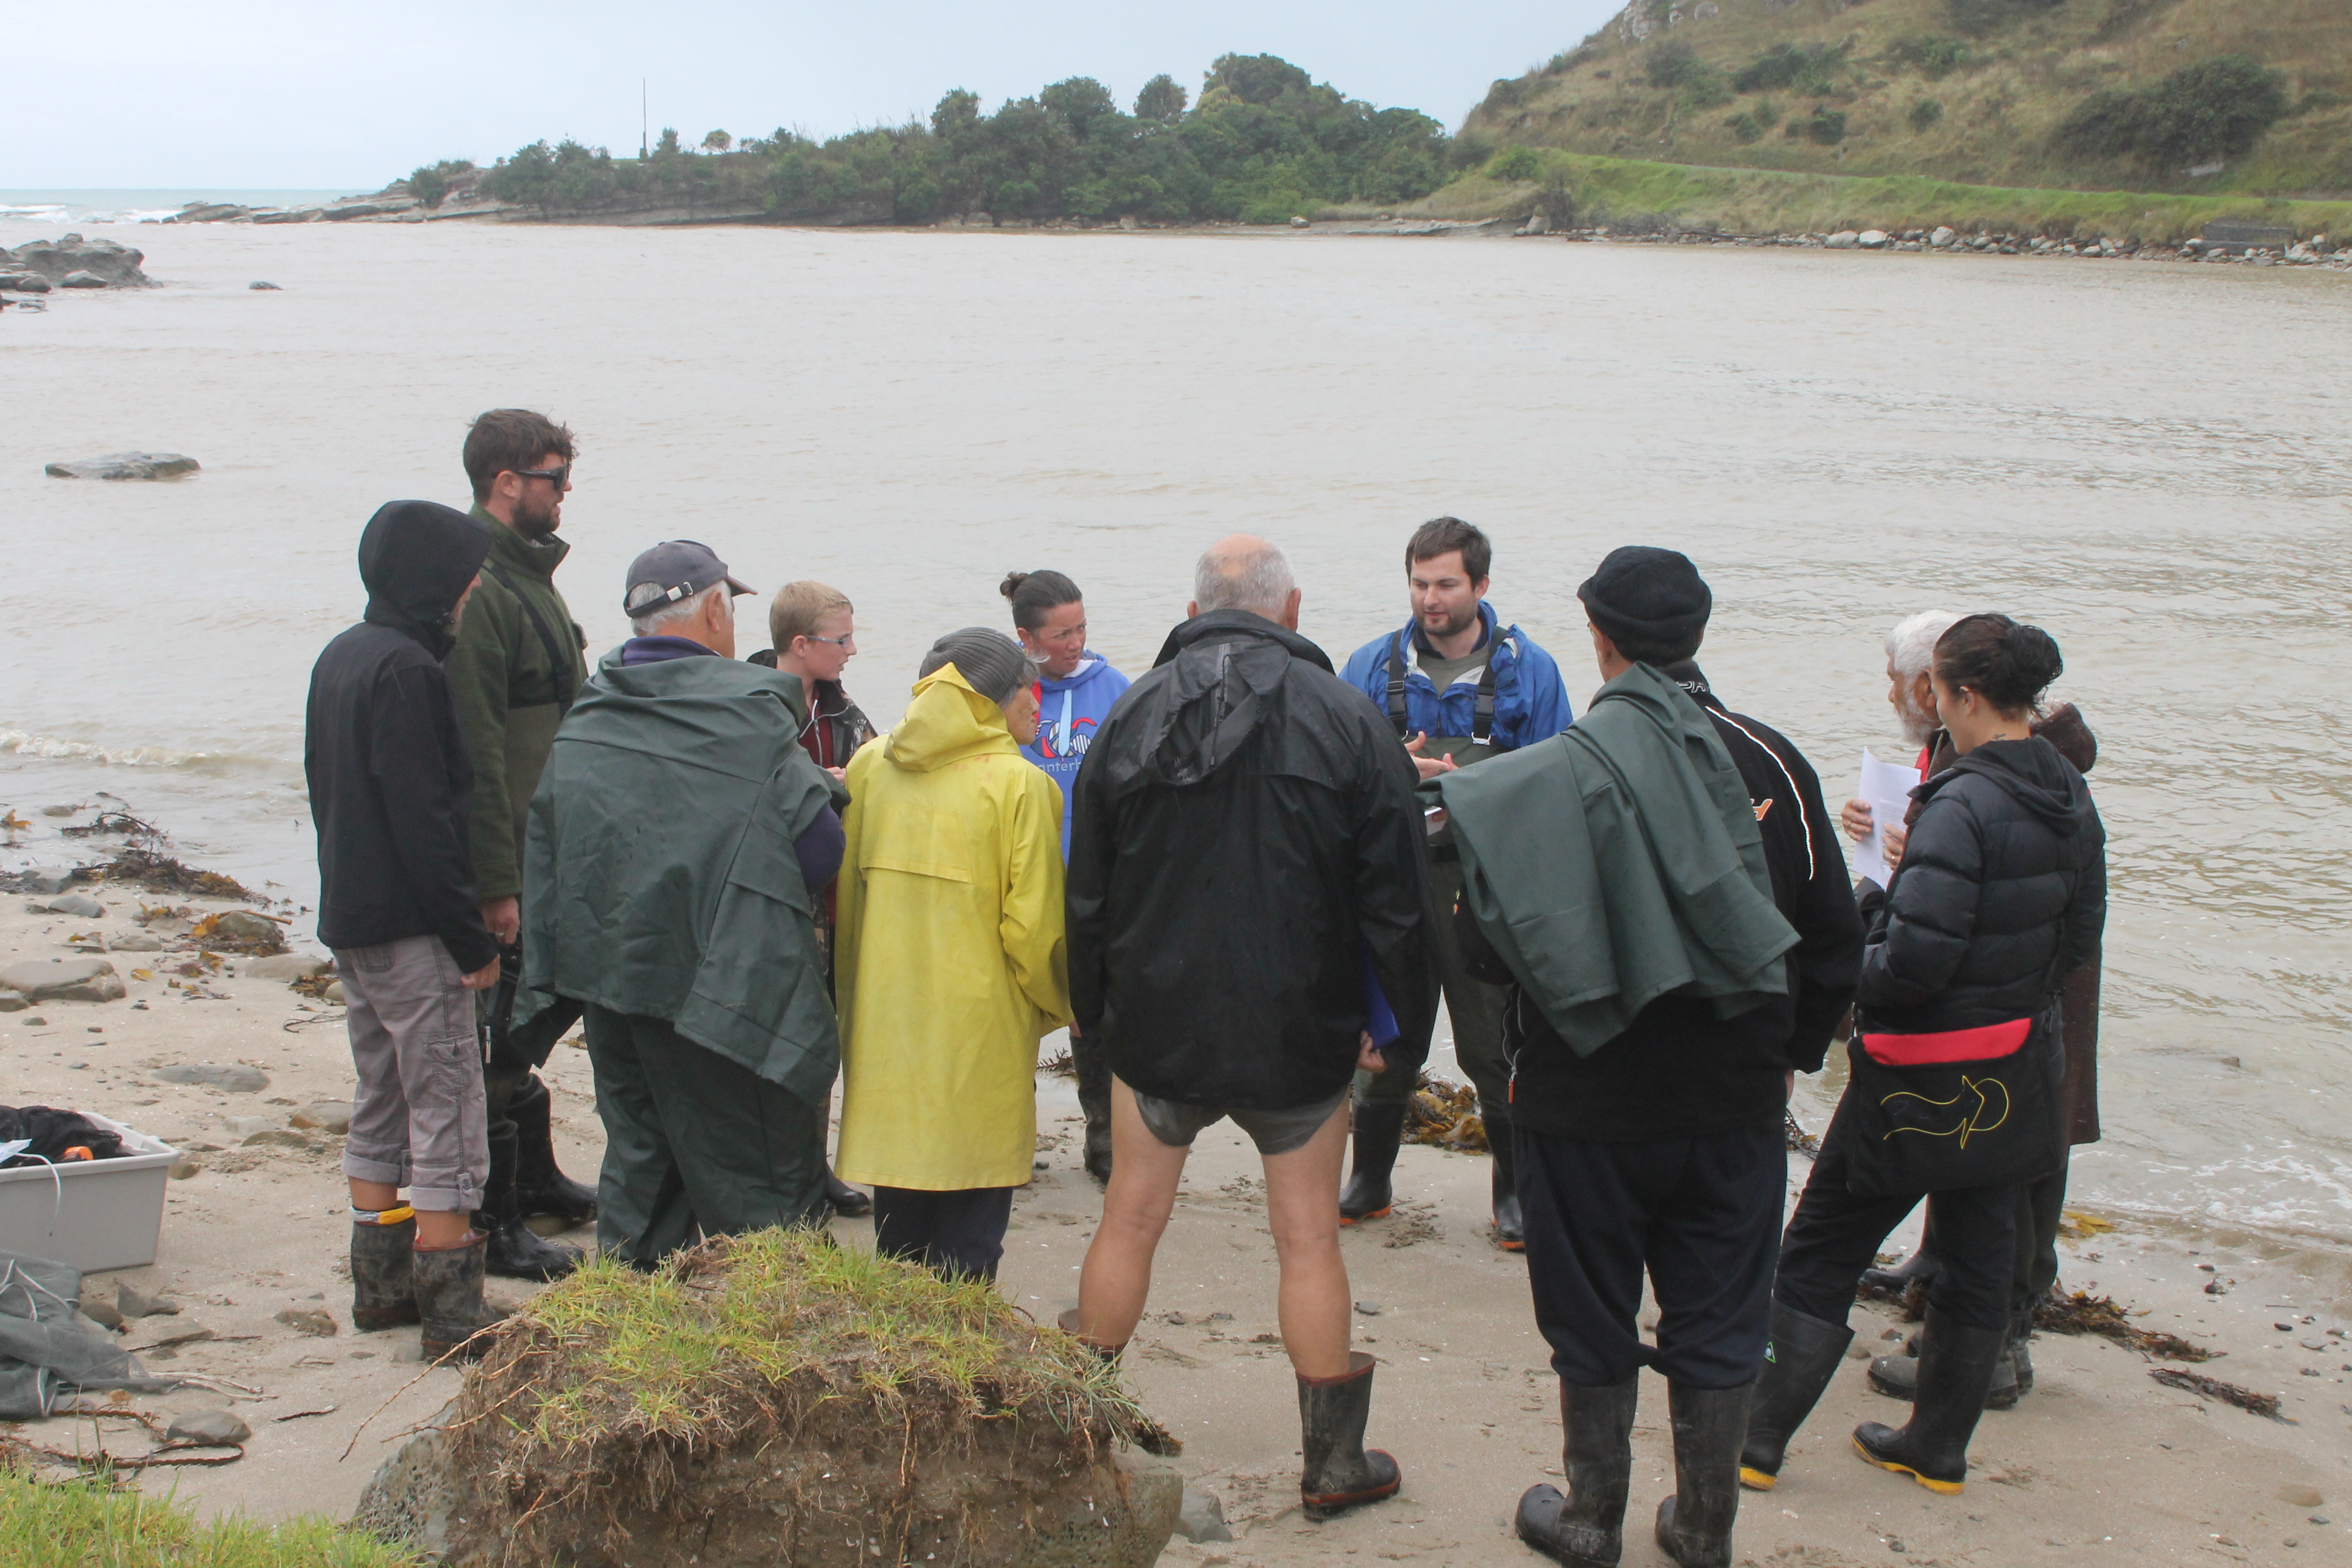 vey was done in August 2014 in order to re assess the community values and tailor a monitoring plan. These values are completely aligned with the values identified in April 2011 but are more specific. The main points raised during the August survey include:
– The in stream values that came back very strongly from the survey are around stream health, water quality and habitat, safe swimming, safe mahinga kai or food gathering both in the fresh and marine ecosystems. These values pivot on Bacterial contamination, nutrient enrichment, sediment loss and in stream habitat quality.
– The need to measure nutrient levels, E Coli, enterococci and sediments both in the fresh and saline environments.
– The need to better understand what fish species are present in the catchment, their abundance, population structure and dynamics.
– The need to test key indicators in the estuary for heavy metals, hydrocarbons and pesticides.
– The need to do a Macro Invertebrate Community Index and periphyton assessment once a year.
– The need to fully disclose all the data collected by different organisations and present it in a form that is understood by everybody.
Monitoring plan summary :
The current monitoring plan is hinged around the community’s values identified previously. The proposal includes:
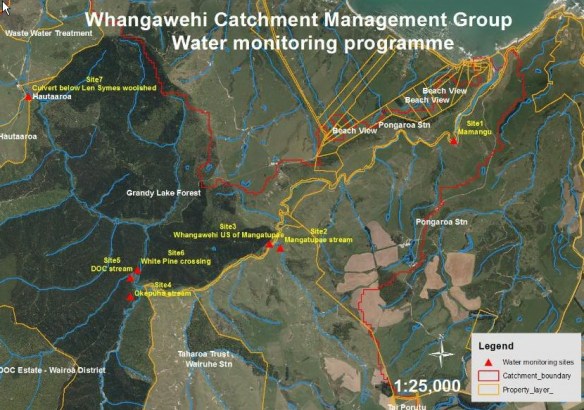
– Number of sites: The selection of 7 sites throughout the catchment. These sites are identical to the sites currently monitored by our Cultural Health Index programme since 2013. They include also all the sites monitored by HBRC since 2011.
– Frequency : Each sites will be monitored every second month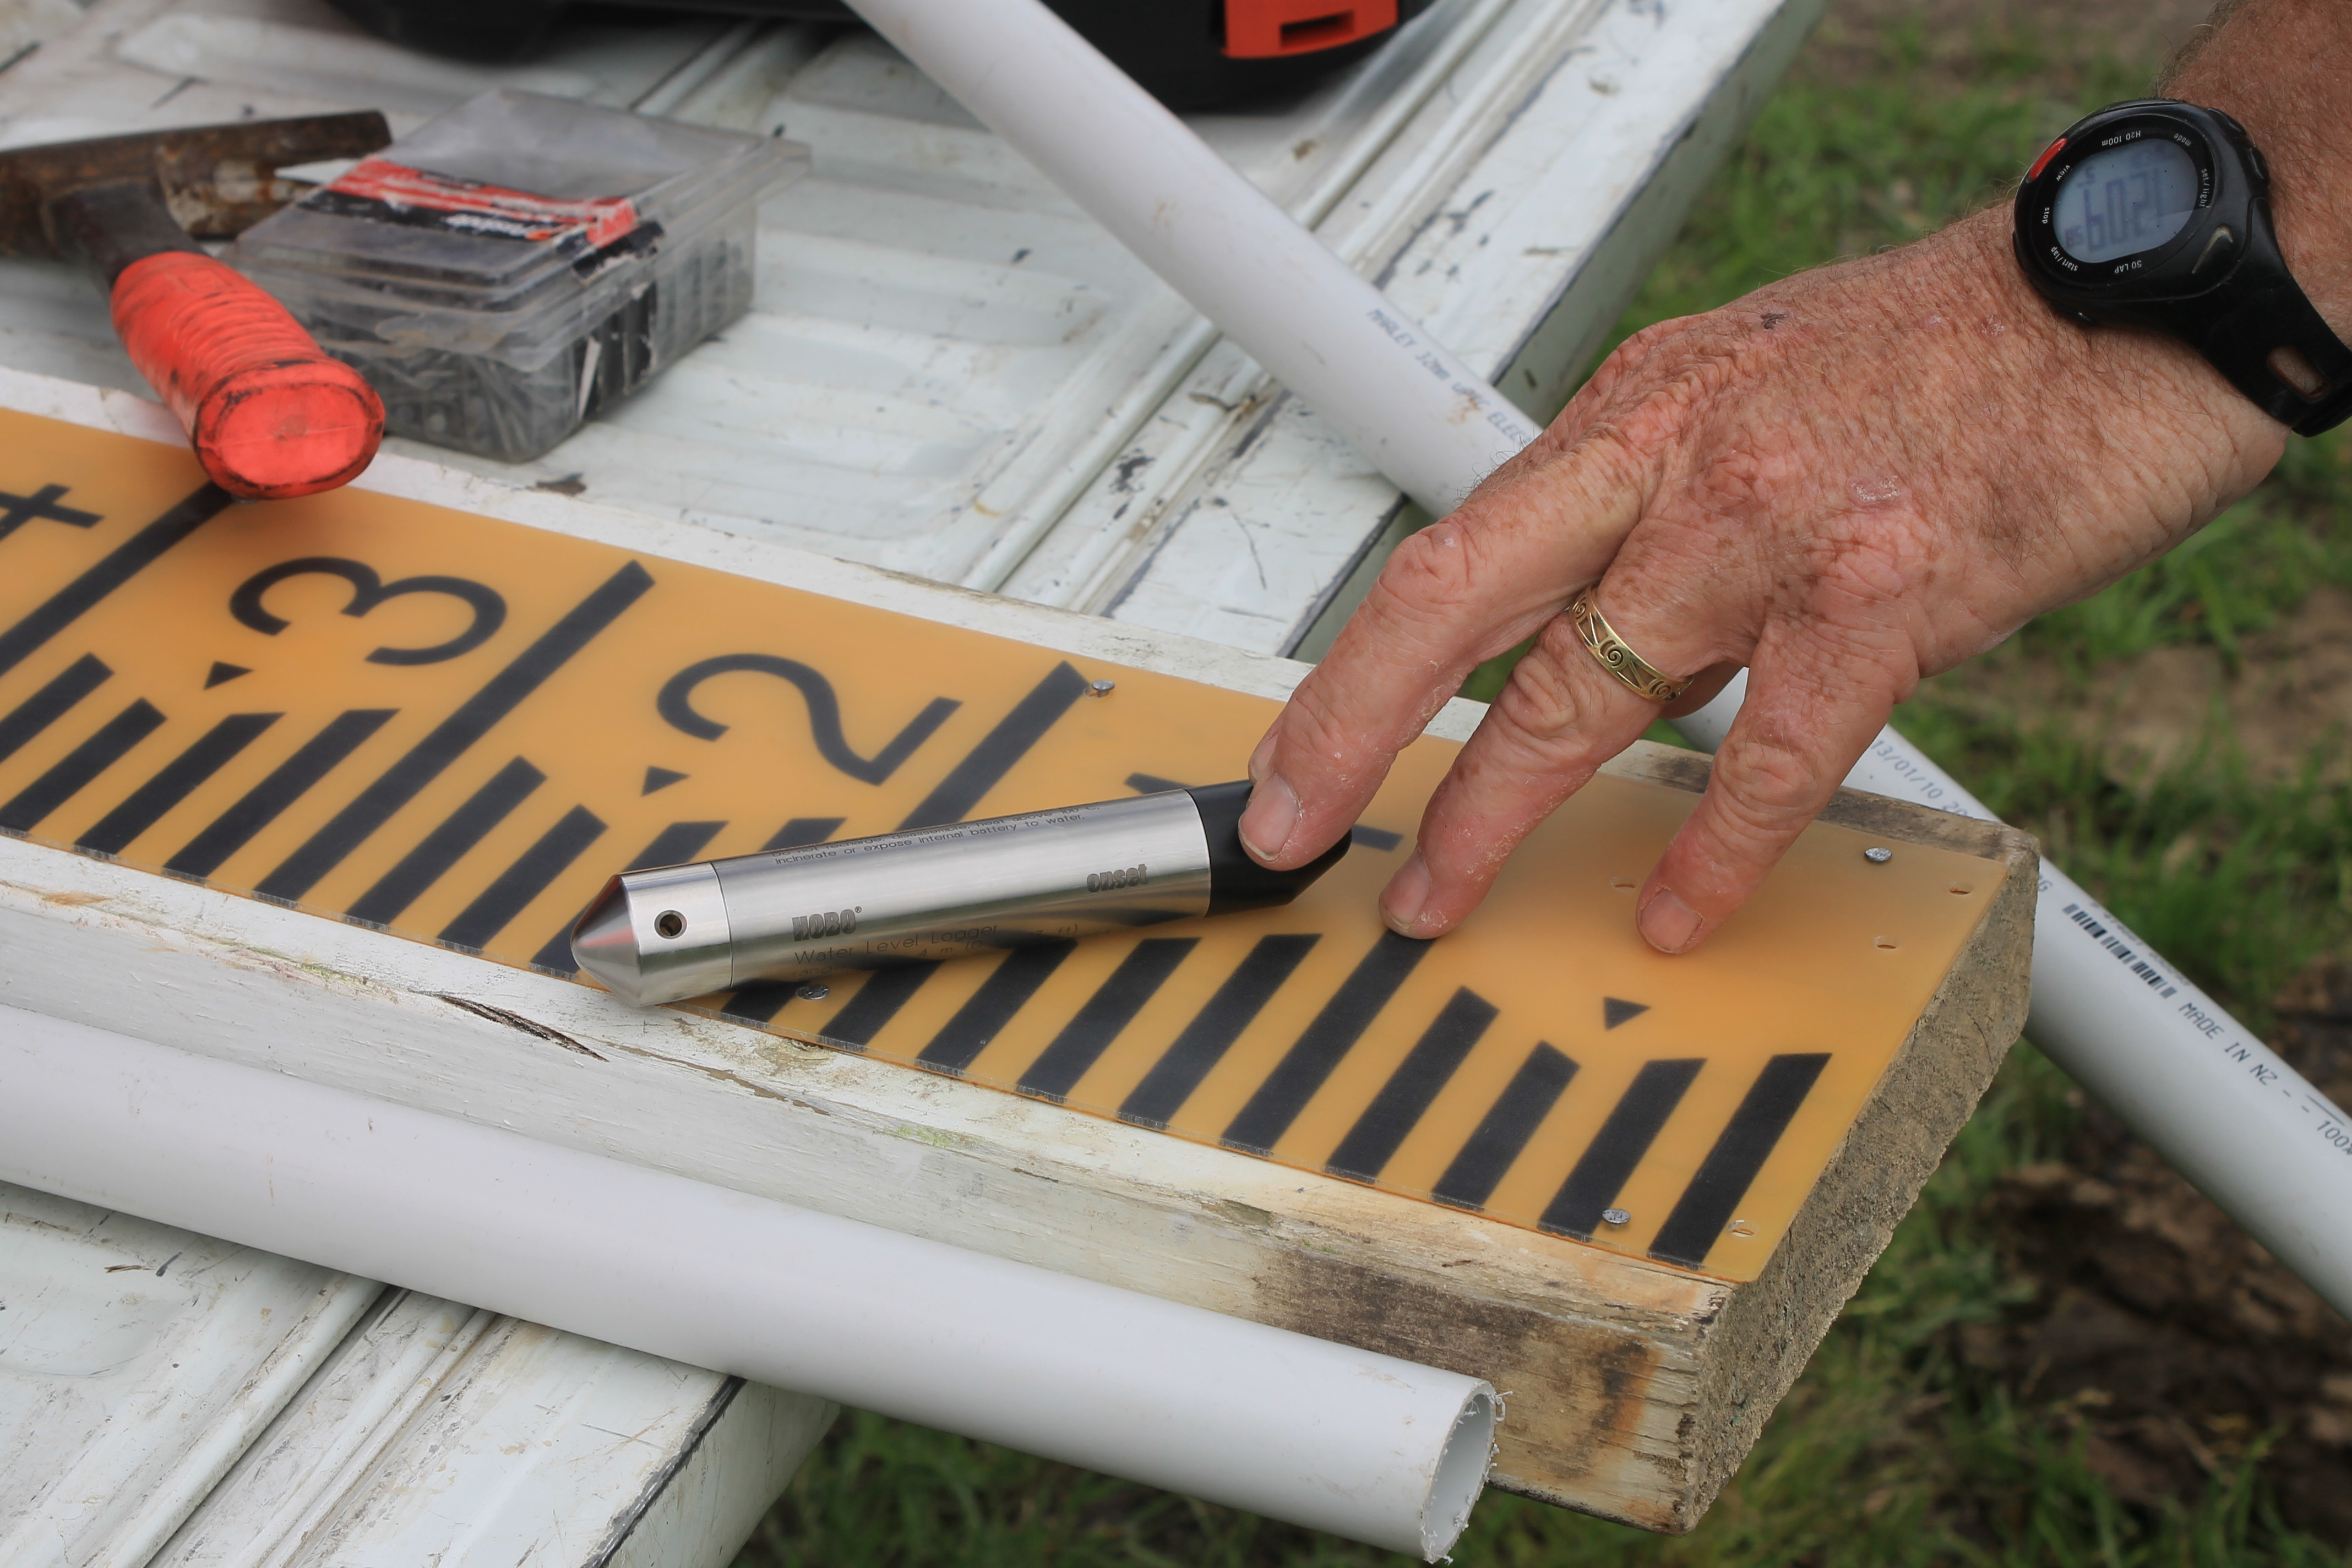
– Parameters measured:
- Flows (Flow and discharge will be done with the assistance of HBRC who set up a logger in November 2014).
- Nutrients
- Faecal bacteria E Coli and Enterococci
- Turbidity, conductivity , Ph and T
- Dissolved oxygen (only during the summer period)
Other components :
-A riparian habitat assessment with photo points will be done
-A comprehensive fish survey will done initially in 2015 and then repeated every 3 to 5 years once stream and catchment enhancement work have progressed.
-Periphyton and stream-bed sedimentation will be monitored on all sampling occasions.
-Annual tissue sampling of key indicators (Cockles or eels) for heavy metals, hydro carbons and pesticides. Because of the costs involved, these tissue samples will have to be readjusted after the first findings.
Project map :